

App of the Day, a site that features a community-nominated iOS app everyday, have released an interesting infographic on app statistics. The infographic visualises various app data including proportionate data between paid and free apps, specific iOS platform data as regards the percentage of apps available to each, app category distribution, and app prices per category.
Here’s a round-up of the main points:
- 67% of apps are paid, 33% are free
- 65% of news apps are free
- $2.43 is the average app price
- 85% of apps are for the iPhone, 7% for the iPad, and 8% of apps are universal
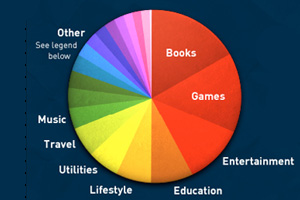
- The most popular app categories are books, games, and entertainment