

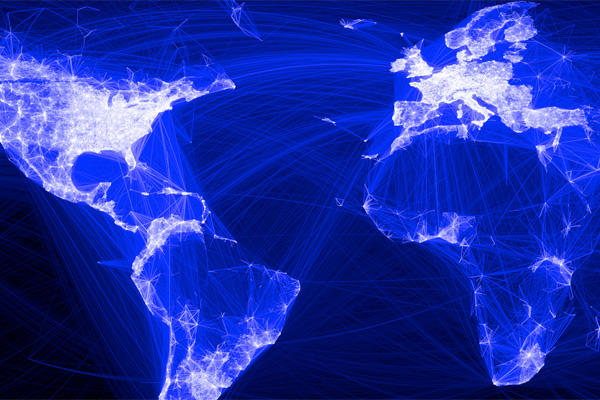
Facebook intern Paul Butler (@paulgb) has created this really interesting visualisation of Facebook relationships around the world. Butler used a subset of 10 millions friend pairs and Facebook social graph data to map friend connections with their geographical locations.

Butler explains some of the challenges he faced in making this visualisation in a Facebook note:
“I began by taking a sample of about ten million pairs of friends from Apache Hive, our data warehouse.
“I defined weights for each pair of cities as a function of the Euclidean distance between them and the number of friends between them. Then I plotted lines between the pairs by weight, so that pairs of cities with the most friendships between them were drawn on top of the others. I used a color ramp from black to blue to white, with each line’s color depending on its weight. I also transformed some of the lines to wrap around the image, rather than spanning more than halfway around the world.
“After a few minutes of rendering, the new plot appeared, and I was a bit taken aback by what I saw. The blob had turned into a surprisingly detailed map of the world. Not only were continents visible, certain international borders were apparent as well. What really struck me, though, was knowing that the lines didn’t represent coasts or rivers or political borders, but real human relationships.
“It’s not just a pretty picture, it’s a reaffirmation of the impact we have in connecting people, even across oceans and borders.”