


In my country, there is a weekly lotto game where participants select 6 numbers from a pool of 37 and another number from a pool of 7. Let’s focus on the first part of the game and disregard the selection of one additional number from a pool of 7.
When it comes to lotteries of the form k/N, where k is the number of desired selections (in our case, 6) out of a total pool of N numbers (in our case, 37), a common question is whether each of these numbers has an equal chance of being part of the winning combination.
Let’s investigate this question.
I’ve gathered statistics from their website for 1609 drawings spanning from 2009 to 2023.
Subsequently, I converted the data from the CSV file into an object:
{
 '09/09/2023': [13, 17, 24, 30, 35, 37],
 '07/09/2023': [7, 17, 19, 25, 35, 37],
 '05/09/2023': [2, 3, 5, 9, 36, 37],
 '02/09/2023': [4, 12, 22, 27, 30, 34],
 '29/08/2023': [6, 8, 15, 19, 26, 31],
 '26/08/2023': [6, 7, 14, 21, 25, 34],
 '22/08/2023': [2, 6, 10, 23, 24, 29],
 ...
}
The key in the object corresponds to the date of the drawing, and the associated value is an array of the numbers that emerged as the winning combination for that specific drawing.
Afterward, I created an array containing all the numbers obtained from the drawings:
numbers = np.array(list(lotto.values())).flatten()

[13, 17, 24, 30, 35, 37,  7, 17, 19, 25, 35, 37,  2,  3,  5,  9, 36, ...]
Following that, I calculated the count of occurrences (frequency) for each value within the array:
count = np.bincount(numbers)[1:]

[268, 256, 257, 242, 255, 273, 247, 277, 260, 267, 289, 294,
 271, 239, 254, 255, 263, 243, 246, 271, 265, 254, 252, 243,
 291, 271, 258, 264, 275, 258, 251, 244, 263, 256, 267, 251, 264]
These results indicate that the number 1 was drawn 268 times, the number 2 was drawn 256 times, and so on.
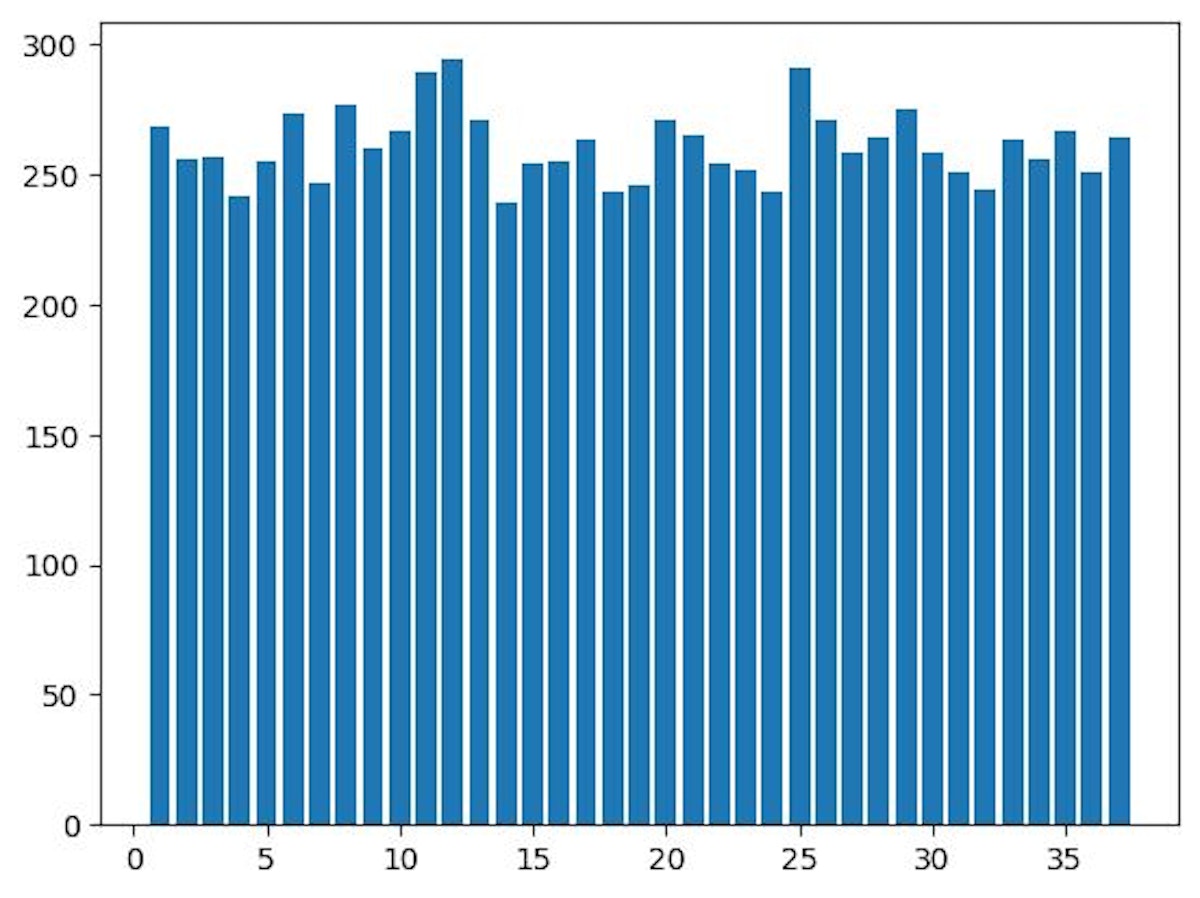
It appears that the distribution of numbers in the lottery results is relatively even. To further confirm this, we can conduct a test to validate the evenness of the distribution.
To test the equiprobability of the N individual numbers, you can follow this approach:
- Calculate the observed frequency (Oi) with which each number i = 1, …, N occurred in the n lottery draws.
- Compute the expected counts (Ei) for each number using the formula Ei = (nk) / N, where n is the total number of lottery draws, k is the number of numbers selected in each draw (in this case, 6), and N is the total number of possible numbers (in this case, 37).
- Use the Pearson statistic or chi-squared statistic to compare the observed counts (Oi) with the expected counts (Ei). The formula for the Pearson statistic is often expressed as:
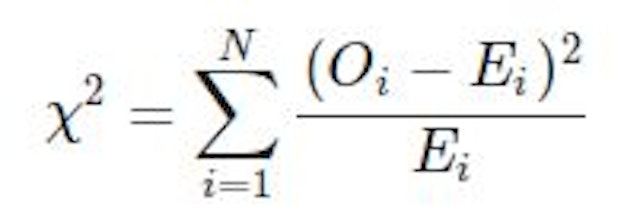
- Calculate the chi-squared statistic using the observed and expected counts.
- Perform a statistical test, such as a chi-squared test, to determine if the computed chi-squared value is statistically significant. This will help you assess whether the distribution of numbers is significantly different from what would be expected under equiprobability.
If the calculated chi-squared value is not statistically significant, it suggests that the numbers are reasonably evenly distributed, supporting the hypothesis of equiprobability. However, if the X^2 value is significant, it would indicate a departure from equiprobability.
Let’s create a function to perform the chi-squared test for equiprobability of numbers:
def chi2(data, size, expect, p_value = 0.05):
  pl = size * 1/expect
  df = expect - 1

  x2_crit_1 = stats.chi2.ppf(p_value, df)
  x2_crit_2 = stats.chi2.ppf(1 - p_value, df)

  x2 = 0
  for i in range(expect):
    x2 += ((data[i] - pl) ** 2)/pl

  accepted = x2_crit_1 < x2 < x2_crit_2 if x2_crit_1 < x2_crit_2 else x2_crit_2 < x2 < x2_crit_1

  return x2, accepted
This function returns the tuple consisting of the chi-squared statistic and result that equiprobability accepted with the probability 1 - 2 * p-value , i.e., extreme values of this discrete uniform distribution have low probability.
N = 37

chi2(count, len(numbers), N)

(25.183136523720748, True)
Certainly, you can use the built-in functionality from the SciPy library to perform the chi-squared test for equiprobability:
from scipy import stats

chi2_statistic, p_value = stats.chisquare(count)

(25.18313652372074, 0.9115057832606053)
Let’s explore combinations of these numbers, starting with pairs:
from itertools import combinations

pairs = list(combinations(range(1, N), 2))
Following this step, we construct a 2D matrix that tracks the occurrences of these pairs:
pairs_count = np.zeros([N] * 2, dtype=int)

for pair in pairs:
  for draw in lotto.values():
    if pair[0] in draw and pair[1] in draw:
      pairs_count[pair[0]][pair[1]] += 1

pairs_count = pairs_count[1:, 1:]
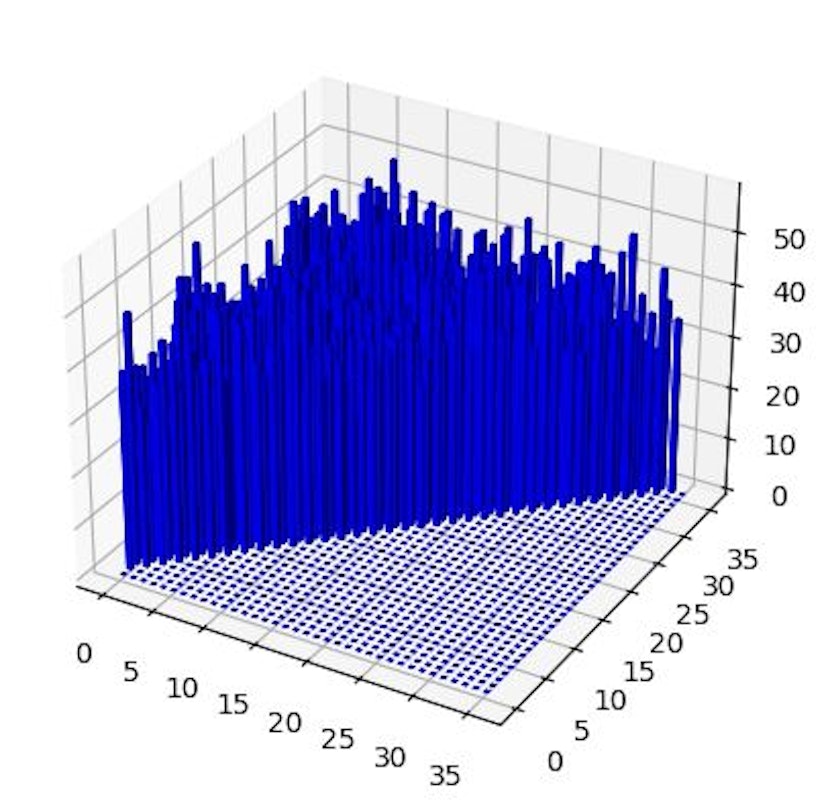
This forms a triangular matrix, as it accounts for the fact that pairs (a, b) and (b, a) are equivalent, and we only tally the occurrences of the pairs (a, b).
My function yields:
counts = pairs_count.flatten()
counts = counts[counts > 0]

chi2(counts, sum(counts), len(counts))

(589.2721893491138, True)
and SciPy provides:
chi2_statistic, p_value = stats.chisquare(counts)

(589.2721893491124, 0.8698507423203673)
How about considering triplets:
comb3 = list(combinations(range(1, N), 3))

comb3_count = np.zeros([N] * 3, dtype=int)

for comb in comb3:
  for draw in lotto.values():
    contains = comb[0] in draw and comb[1] in draw and comb[2] in draw
    if contains:
      comb3_count[comb[0]][comb[1]][comb[2]] += 1

comb3_count = comb3_count[1:, 1:, 1:]

counts = comb3_count.flatten()
counts = counts[counts > 0]

chi2(counts, sum(counts), len(counts))

(6457.575829383709, False)
Something has gone awry, possibly due to the matrix’s high sparsity. The chi-squared value falls below the lower critical chi-squared threshold:
6457.575829383709 < 6840.049842653838
However, when using SciPy, the result is:
chi2_statistic, p_value = stats.chisquare(counts)

(6457.575829383886, 0.9999997038479482)
Now, let’s identify the number that has been drawn most frequently:
count.argmax() or list(count).index(max(count))

11
Let’s not jump to conclusions just yet. We can examine how this number has evolved over the years:
year_result = dict()
for year in range(2009, 2024):
  new_dict = {k:v for (k,v) in lotto.items() if str(year) in k}
  year_result[year] = np.bincount(np.array(list(new_dict.values())).flatten())[1:].argmax()

{
 2009: 16,
 2010: 10,
 2011: 11,
 2012: 24,
 2013: 32,
 2014: 34,
 2015: 21,
 2016: 25,
 2017: 5,
 2018: 10,
 2019: 24,
 2020: 11,
 2021: 12,
 2022: 14,
 2023: 11
}
Or, alternatively, we can analyze the cumulative changes over time:
year_result = dict()
arr = []
for year in range(2009, 2024):
  new_dict = {k:v for (k,v) in lotto.items() if str(year) in k}
  arr += list(np.array(list(new_dict.values())).flatten())
  year_result['2009 - ' + str(year) if year > 2009 else str(year)] = np.bincount(arr)[1:].argmax()

{
        '2009': 16,
 '2009 - 2010': 10,
 '2009 - 2011': 11,
 '2009 - 2012': 20,
 '2009 - 2013': 20,
 '2009 - 2014': 20,
 '2009 - 2015': 34,
 '2009 - 2016': 20,
 '2009 - 2017': 10,
 '2009 - 2018': 10,
 '2009 - 2019': 10,
 '2009 - 2020': 10,
 '2009 - 2021': 10,
 '2009 - 2022': 24,
 '2009 - 2023': 11
}
Lastly, we can also investigate whether identical drawings have ever occurred:
lotto_counts = {}
for k, v in lotto.items():
  v_str = str(v)
  if v_str in lotto_counts:
     lotto_counts[v_str] += [k]
  else:
     lotto_counts[v_str] = [k]

result = {k: v for k, v in lotto_counts.items() if len(lotto_counts[k]) > 1}

{
  '[13, 14, 26, 32, 33, 36]': ['16/10/2010', '21/09/2010']
}
It’s amusing to note that these occurrences happened nearly back-to-back.
As we wrap up our journey into the world of lottery data, it’s been a wild ride through numbers and probabilities. We’ve uncovered some interesting tidbits – from pairs and triplets to spotting the most popular numbers.
Lotteries are all about unpredictability, but it’s fun to peek behind the curtain and explore the quirks of these games. Whether you’re a player or just a curious observer, the world of numbers always has a surprise or two up its sleeve.
This article was originally published by Alexthoughts on Hackernoon.