
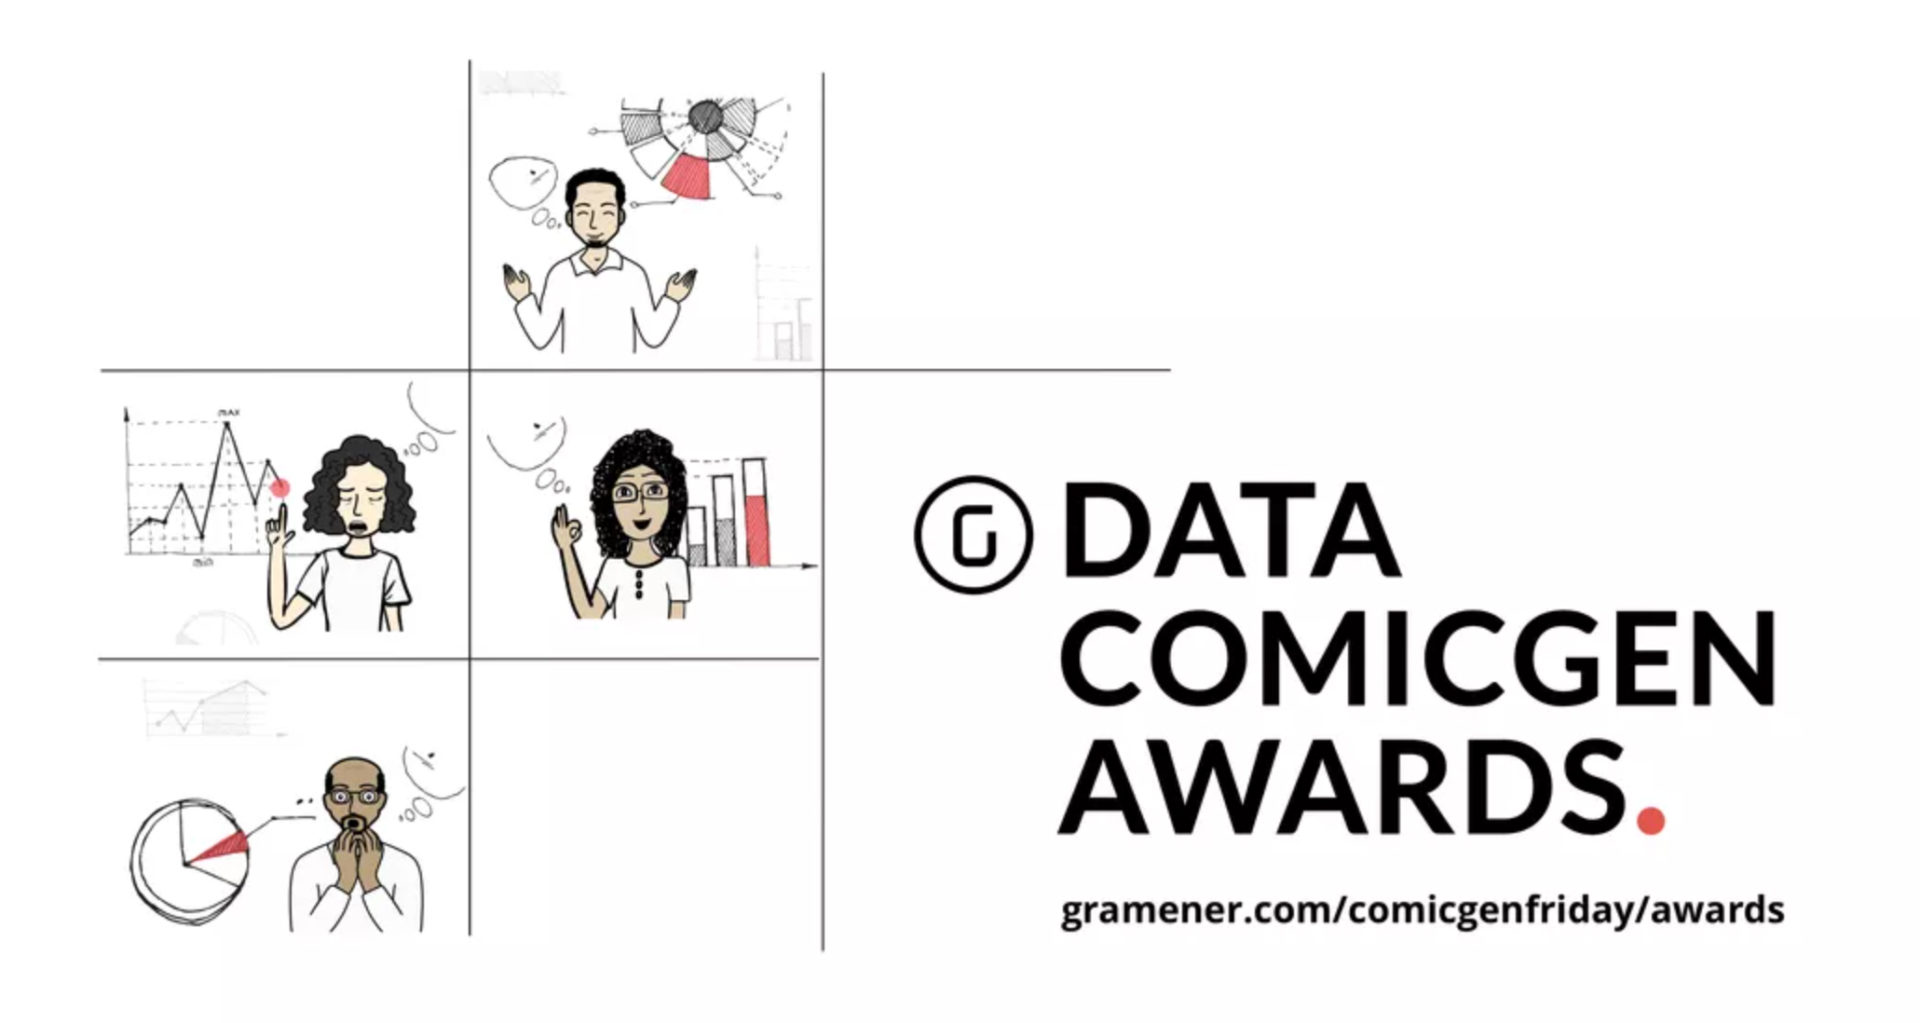
Award-Winning Consulting and AI company Gramener is announcing a contest specifically for data comics. The competition, which opens in August, targets working professionals and university students with skills in data science and business analytics.
The objective of this year’s contest is to create data comics in Google Sheets using Gramener’s fun and free of charge data comic generator, Comicgen.
The DataComic Gen Awards jury is comprised of popular experts from the data community, namely Alli Torban, Duncan Geere, Gurman Bhatia and Kat Greenbrook, who are analyzing submissions according to criteria like clarity of message, visual and textual aesthetics, storyline and script, and principles of data visualisation.
The dataset for the competition will be released on August 5, 2021. Competitors will use Comicgen to create their comic in Google Sheets. Entry is free and submissions can be from an individual or team of two. The deadline for submission is 1:30 PM EDT on August 26, 2021. Three winners will be selected to win monetary prizes worth up to 350 dollars.

Key Competition Dates:
August 5th: Dataset for the challenge is revealed
August 26th: Deadline for submission
October 1st: Showcase of entries
October 8th: Longlist is revealed
October 15th: Shortlist is revealed
October 22nd: Results are announced
Gramener: a design-led data science company
Founded in 2010 by ex-IMB IT staff, Gramener helps solve complex business problems using compelling data stories. Gramener utilizes a low-code analytics platform tailored to each industry or company’s needs.
One of India’s fastest growing companies, Gramener supports large and small enterprises with data insights by leveraging machine learning, artificial intelligence, automated analysis, and visual intelligence. Their services and technology have been recognized by Gartner and the company has won several awards including the Microsoft “AI For All” award.
What is a data comic?
Data comics seek to answer questions such as how to engage and guide an audience and how to break down complexity. According to the University of Maryland, data comics utilizes storytelling, which is “where a sequence of events are conveyed using plot, locations, and characters.” It’s an effective way to communicate because of the “typically high degree of common ground shared between narrator and listeners,” according to the authors of the study.
 Studies reflect the potential of data comics to reach a wide audience and suggest participants largely prefer data comics in terms of enjoyment, focus, and overall engagement. Comics improve understanding and recall of information and have been shown to be very effective at communicating information from news to science to reports. “Comics have the potential to make scientific subjects more accessible and engaging for a wider audience,” writes Matteo Farinella in the Journal of Science Communication.
With data comics, designers tell a story. Putting a lot of data in front of a person, which they are required to read and interpret, doesn’t necessarily communicate insights about the data itself. Unlike most infographics, the data comic is much more explicit. This novel method of storytelling uses sequential art constructed from data-driven visualization – generally in a narrative constructed from panels. Data such as numbers and dates are portrayed in a simple, easy-to-understand, often animated layout.
Paging through a chart or diagram about sales trends or workflow optimization is tedious and easy to misinterpret. However, a simple data comic highlighting the most necessary information saves time and aids understanding. Gramener has created visuals of President Trump tweets, highlighting his most used words, supply chain analytics, and grants administered by Bill and Melinda Gates formatted as a grid of their image with each box representing a grant that has been awarded.
 In our highly visual world today, what we see is crucial to what we can understand. Gramener chief executive officer and Gramener cofounder Anand S. believes that visual storytelling has the power to influence decisions. “We want to club data with storytelling to help our clients make clear business decisions,” he says.
Comicgen, Make Your Own Comics
Comicgen is a Gramex “Make Your Own Comic” microservice to help non-programmers create data stories and is self-described as “an open source comic creator for folks who can’t draw.” It is the comic library that gives back. Gramex is a low-code data science platform designed by Gramener and is cost free and accessible for everyone, regardless of skill level, to learn how to create their own data comics step by step and even to compete with other designers.
Disclosure: This article mentions a client of an Espacio portfolio company.